Features for every job on the estate
Ten modules built around the individual tree and rolled up to block, orchard, farm and enterprise. Scores are indicative and show their reasons.
Modules are being rolled out in stages. Ask in the demo what is live for your crop today and what is planned. Screens shown use sample data.
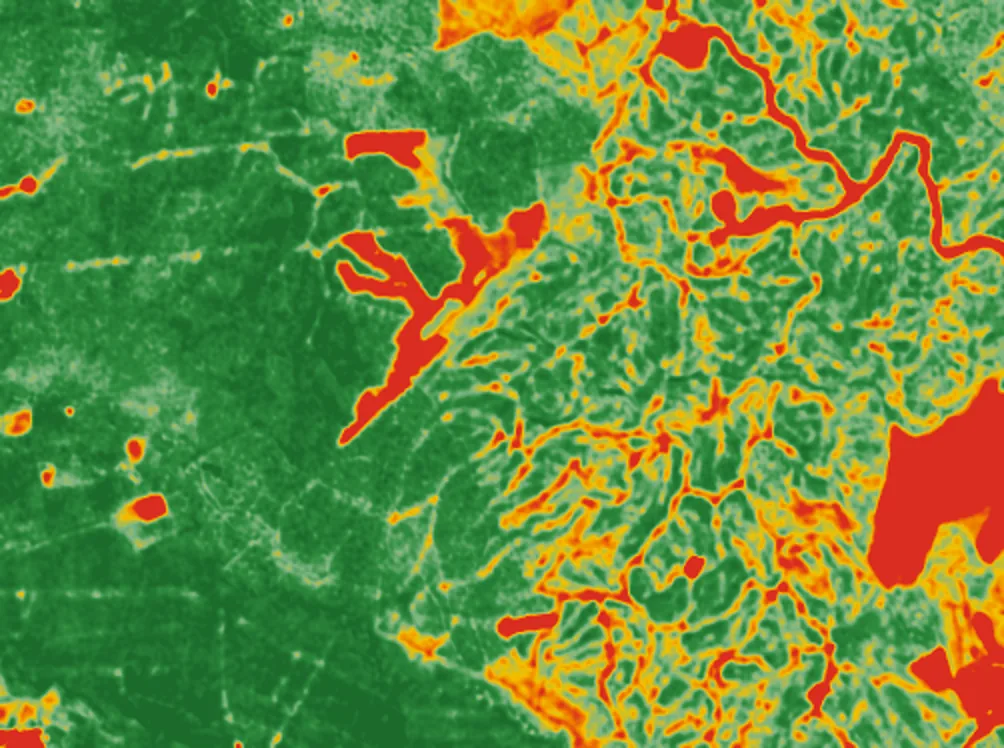
See how every tree is doing, block by block.
Satellite imagery is read at tree level, so a weak patch shows up as individual trees instead of a block average. Health bands are set per crop and growth stage, and each band shows the reasons behind it.
- Tree-level health bands, rolled up to block, orchard and farm
- Thresholds per crop and stage, not one band for everything
- Every score is marked indicative and shows why it was given
Tree health from satellite · for agronomists, estate managers
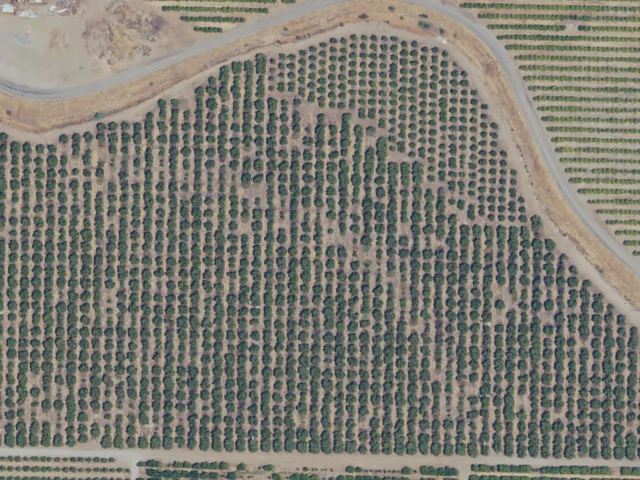
Know how many trees you really have, and where gaps are.
Count standing trees from canopy and flag missing or dead ones against what should be planted. Gaps feed straight into replanting plans, with allowance for young trees whose canopy is still small.
- Canopy-based count per block
- Missing and dead tree detection with an age exemption
- Gap maps that feed replanting
Stand census and missing trees · for owners, planners
Plan replanting from the trees, not from guesswork.
Use the census and tree age to decide which blocks to replant and what it is likely to cost. Cycle length, cost to replant and time to first yield come from the crop, not a fixed palm assumption.
- Replanting calculator by block
- Crop lifespan and time to first yield from the catalogue
- Replanting budget with removal and replant cost lines
Replanting and budget · for owners, finance
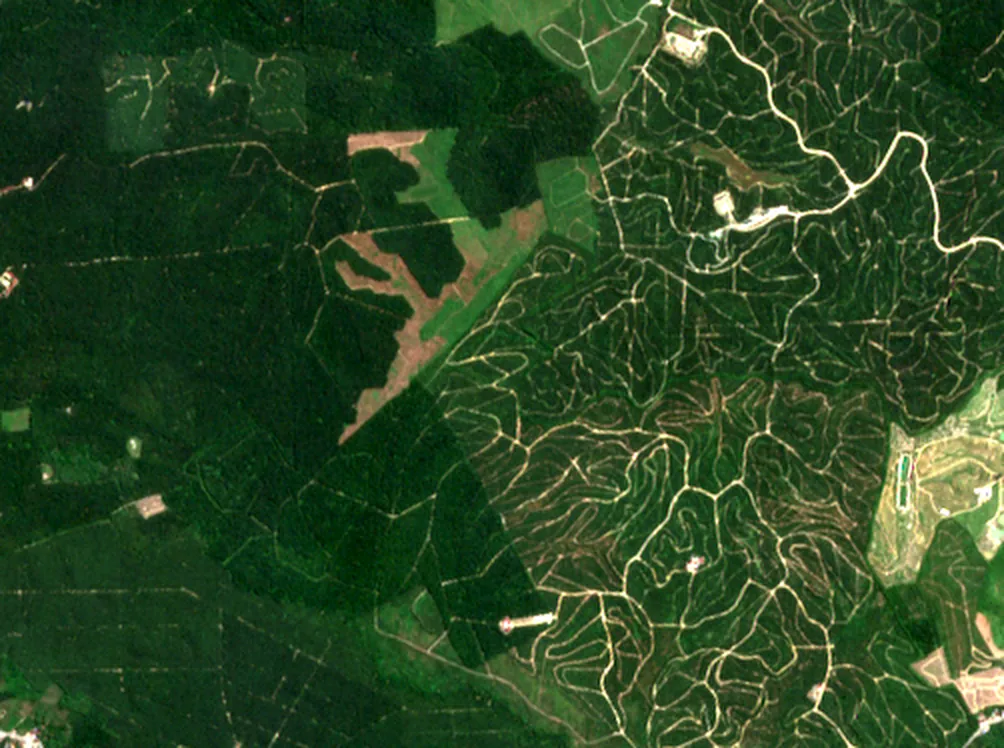
Catch problems while they are still small.
Crop-specific pest and disease lists, weather-driven risk and satellite signals come together as alerts. Scouting tasks send your team to the right trees first.
- Crop-specific pest and disease catalogue
- Weather-driven risk indications
- Alerts with a visible reason
Pest and disease alerts · for agronomists, field staff
Rain, heat, frost and irrigation in one view.
Forecast and history for each block, with the agronomy that matters per crop: chill hours, growing degree days, frost and heat stress, and water balance from crop coefficients and evapotranspiration.
- Rainfall and temperature by block
- Frost and heat risk by crop stage
- Chill hours and degree-day tracking where the crop needs them
Weather and water · for growers, irrigation managers
Plan harvest labour and read yield with confidence.
Maturity is crop-specific, from fruit colour to dry matter or nut moisture. Harvest windows come from the crop catalogue and your own records, and yield is forecast from tree counts, age and health.
- Harvest readiness by block
- Yield forecast in kg per tree and t/ha
- Labour harvesting records
Harvest readiness and yield · for operations, owners
Hotspots near your land, before they reach it.
Active fire hotspots from NASA FIRMS are shown near your blocks with risk and burn-area context, and incidents can be logged and followed.
- Hotspot detection near your boundaries
- Fire risk context
- Burn area and incident log
Fire watch · for estate managers, security
Fly over your estate on real terrain.
Every view works on a map. Switch from a flat 2D map to a 3D view over real terrain elevation, with trees, blocks and alerts drawn where they actually are.
- Block census and farm overview maps
- 2D to 3D with one camera move
- Real terrain, no invented heights
2D and 3D maps · for everyone
All estates in one place for head office.
Roll every farm, orchard and block into one overview with area, tree counts, crop mix and health trend, so head office sees the whole portfolio and drills into the estate that needs attention.
- Farm, orchard and block hierarchy
- Crop mix, area and tree counts
- Health trend across estates
Enterprise overview · for plantation groups, owners
Turn alerts into work orders and records.
Alerts become scouting tasks for field staff with the tree, the reason and a place to record what was found. The field app is planned for phone use with offline support.
- Alerts turned into tasks
- Tree-level records and photos
- Weeding, fertiliser and input tracking
Scouting and field work · for field teams, supervisors
Evidence for buyers, auditors and your own targets.
Carbon estimates use per-crop biomass factors, and reports bring farm summaries, block health, harvest and input costs together. Compliance support starts with GlobalG.A.P.
- Carbon estimates per crop
- PDF and Excel reports
- GlobalG.A.P. support first
Carbon and compliance · for sustainability, compliance
See your own estate in Plantation Monitoring
Tell us your crops and area. We will show you what the satellite sees in a short demo, and what it would take to roll out across your estates.